Endpoint monitoring with Prometheus and Blackbox Exporter
As a DevOps engineer, I am working on the migration of the CaaS (Cloudify as a Service) solution to Kubernetes (EKS), which includes monitoring of multiple critical endpoints with Prometheus/Grafana.
I will describe in this post how I do it.
Prerequisites
-
Existing k8s cluster, EKS in my case.
-
Prometheus/Grafana Installed to your cluster, I am using kube-prometheus-stack
kube-prometheus-stack
Installs the kube-prometheus stack, a collection of Kubernetes manifests, Grafana dashboards, and Prometheus rules combined with documentation and scripts to provide easy to operate end-to-end Kubernetes cluster monitoring with Prometheus using the Prometheus Operator.
Let’s start.
Problem Definition
CaaS (Cloudify as a Service) solution depends on multiple endpoints to be constantly available, like API endpoint, license generation endpoint for each CaaS environment, external services of HubSpot which are tightly integrated into CaaS, and multiple other endpoints. If one of these endpoints goes down I want to be notified immediately.
For this exampe I will monitor 3 endpoints using the HTTP/HTTPS status checks:
- api.myorganization.com
- license.myorganization.com
- api.hubspot.com
Solution
To solve this problem I had 3 options:
- Use external product/service for monitoring which supports status checks via HTTP/HTTPS protocols.
- To build my solution, using k8s cron jobs or write some scheduled job(script) with my CI (Jenkins).
- Use Prometheus/Grafana.
And the winner is Prometheus/Grafana, because that is exactly what a monitoring solution like Prometheus must do, besides that I am already using Prometheus for monitoring in general.
Blackbox Exporter
https://github.com/prometheus/blackbox_exporter
The blackbox exporter allows blackbox probing of endpoints over HTTP, HTTPS, DNS, TCP and ICMP.
A great example of what you can do with black box exporter: https://github.com/prometheus/blackbox_exporter/blob/master/example.yml
Deploying Blackbox Exporter to EKS with helm
https://github.com/prometheus-community/helm-charts/tree/main/charts/prometheus-blackbox-exporter
$ helm repo add prometheus-community https://prometheus-community.github.io/helm-charts

$ helm repo update

$ helm install prometheus-blackbox-exporter prometheus-community/prometheus-blackbox-exporter
This is how the config of black box exporter looks like after installation:
# kubectl describe configmap prometheus-blackbox-exporter
Name:         prometheus-blackbox-exporter
Namespace:    monitoring
Labels:       app.kubernetes.io/instance=prometheus-blackbox-exporter
              app.kubernetes.io/managed-by=Helm
              app.kubernetes.io/name=prometheus-blackbox-exporter
              app.kubernetes.io/version=0.19.0
              helm.sh/chart=prometheus-blackbox-exporter-5.0.3
Annotations:  meta.helm.sh/release-name: prometheus-blackbox-exporter
              meta.helm.sh/release-namespace: monitoring
Data
====
blackbox.yaml:
----
modules:
  http_2xx:
    http:
      follow_redirects: true
      preferred_ip_protocol: ip4
      valid_http_versions:
      - HTTP/1.1
      - HTTP/2.0
      valid_status_codes:
      - 200
      - 403
    prober: http
    timeout: 5s
It’s worth mentioning that I added:
valid_status_codes:
- 200
- 403
because one of my endpoints returns 403 status and I still want to see success/green in grafana for this endpoint instead of failure/down.
Modify Prometheus.yaml
In my case I am using kube-prometheus-stack, so what I need is to modify values.yaml of this helm chart:
additionalScrapeConfigs:
  - job_name: blackbox
    metrics_path: /probe
    params:
      module: [http_2xx]
    static_configs:
      - targets:
        - https://api.myorganization.com
        - https://license.myorganization.com
        - https://api.hubspot.com
    relabel_configs:
    - source_labels: [__address__]
      target_label: __param_target
    - source_labels: [__param_target]
      target_label: instance
    - target_label: __address__
      replacement: prometheus-blackbox-exporter.monitoring:9115
If you not using this helm chart, you can add this to prometheus.yaml instead
prometheus-blackbox-exporter.monitoring is the DNS name of prometheus-blackbox-exporter service, monitoring is namespace:
$ kubectl get services | grep blackbox
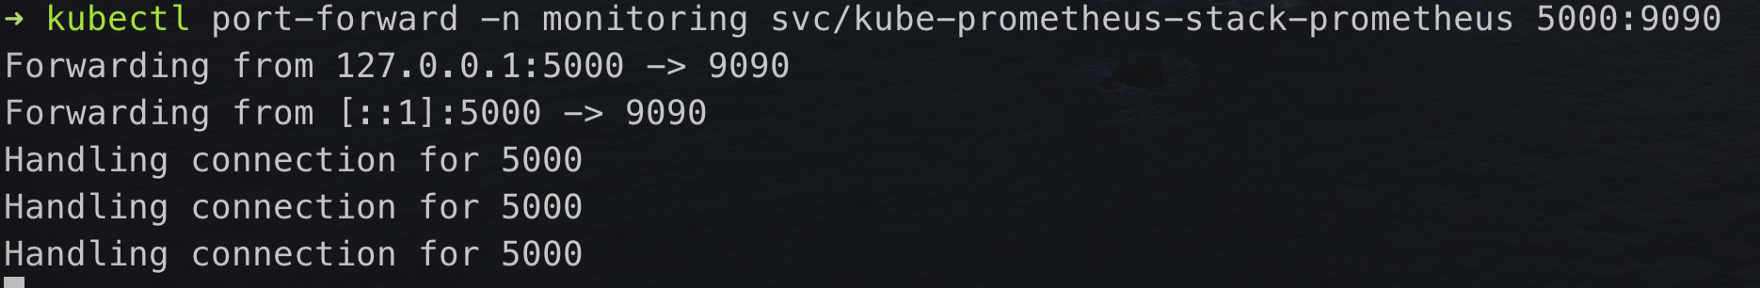
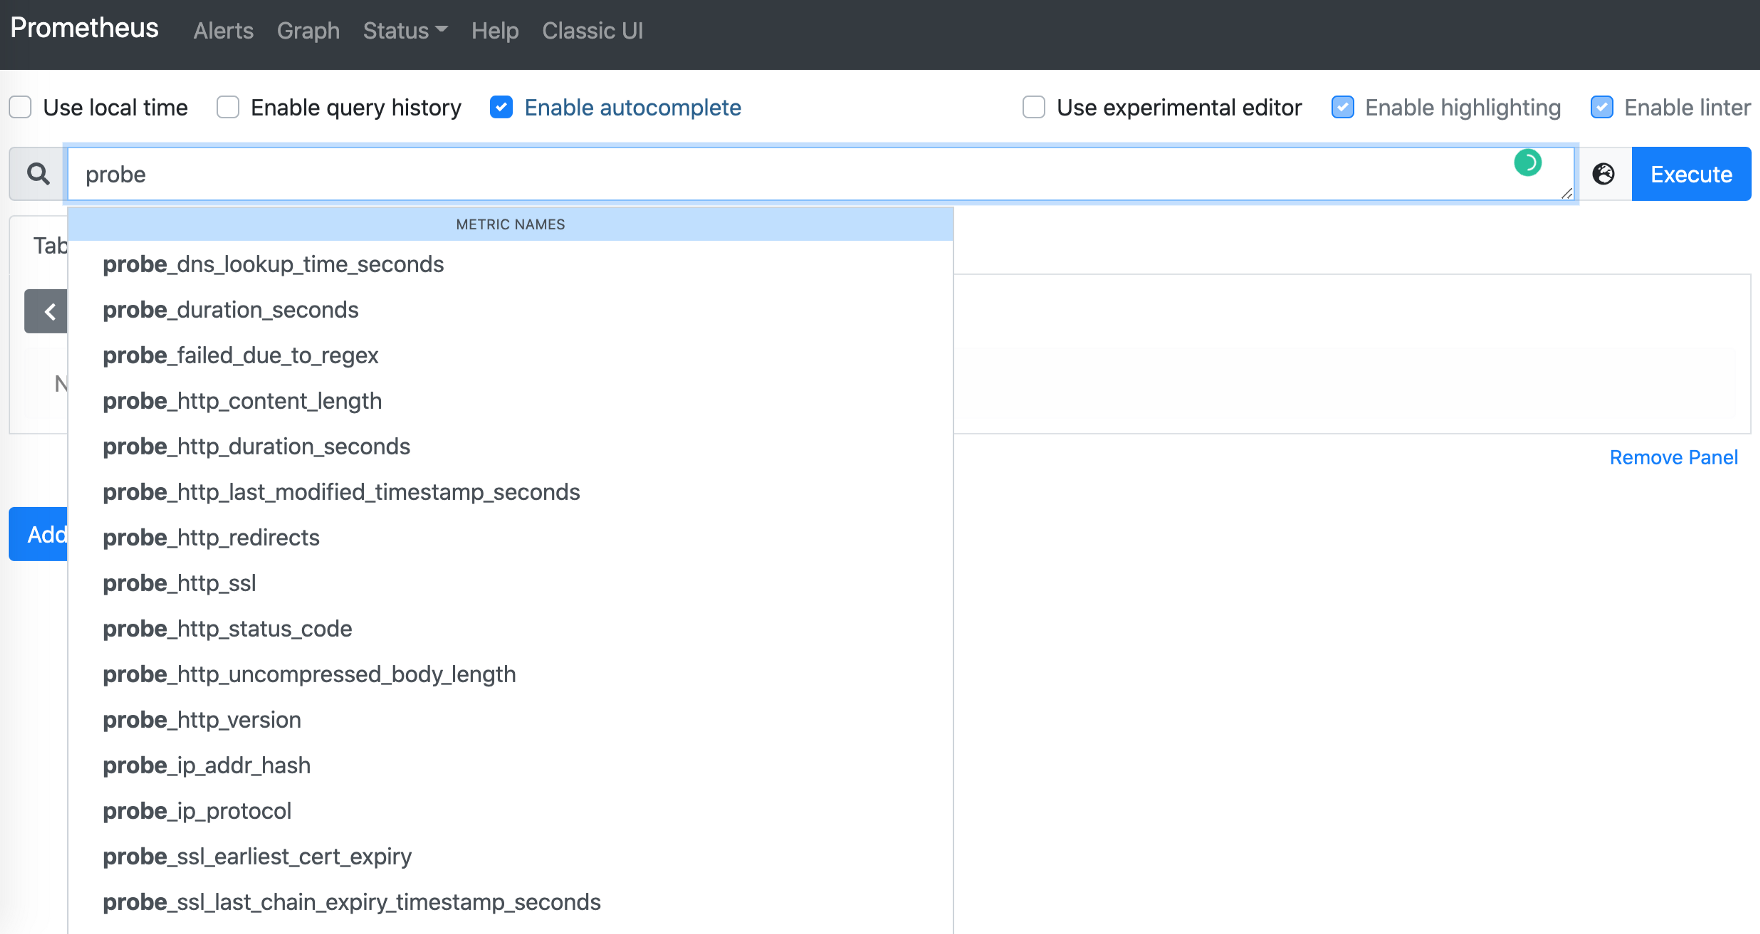
prometheus-blackbox-exporter ClusterIP 172.20.89.193 <none> 9115/TCP 9hVerify your metrics coming to prometheus
Adding Alerts
I created endpoint-alerts.yaml, which is PrometheusRule resource, CRD of Prometheus Operator.
apiVersion: monitoring.coreos.com/v1
kind: PrometheusRule
metadata:
  labels:
    app: kube-prometheus-stack
  name: endpoint-alerts
  namespace: monitoring
spec:
  groups:
  - name: critical-rules
    rules:
    - alert: ProbeFailing
      expr: up{job="blackbox"} == 0 or probe_success{job="blackbox"} == 0
      for: 10m
      labels:
        severity: critical
      annotations:
        summary: Endpoint Down
        description: "Endpoint is Down\n "
Deploy endpoint-alerts.yaml
$ kubectl apply -f endpoint-alerts.yamlGrafana Dashboard
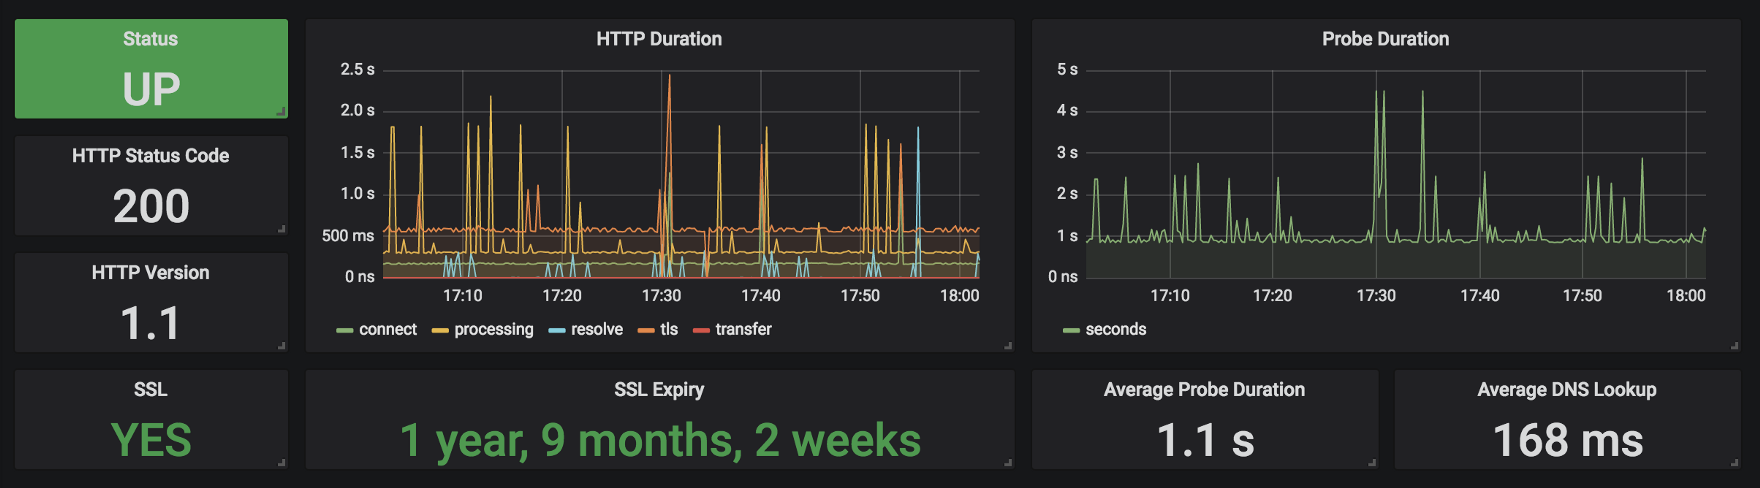
I used existing dashboard: https://grafana.com/grafana/dashboards/7587
Go to Grafana -> + sign -> Import and enter 7587 number.
In this post, I described how to monitor multiple endpoints critical to your application with Prometheus, Grafana and Blackbox Exporter.
Thank you for reading, I hope you enjoyed it, see you in the next post.
Please subscribe to my YT channel
If you want to be notified when the next post of this tutorial is published, please follow me on Twitter @warolv.
Medium account: warolv.medium.com