
Practical example of how to set requests and limits on Kubernetes
I am a DevOps engineer at Cloudify.co, in this post, I will share my thoughts on how to properly set requests and limits for your workloads on Kubernetes.
So, why should we care about requests/limits at all?
Setting the right resource requests and limits for your workloads is important for stability and cost efficiency. If your Pod resource sizes are smaller than your workloads require, your application can either be throttled or it can fail due to out-of-memory errors. If your resource sizes are too large, you have waste and, therefore, larger bills.
https://cloud.google.com/kubernetes-engine/docs/concepts/verticalpodautoscaler
To put it simply, if you not set requests/limits properly, your application might fail/be throttled, or you will overprovision your resources and it will cost you a lot.
Prerequisites
-
Existing k8s cluster, EKS in my case.
-
Prometheus/Grafana Installed to your cluster, I am using kube-prometheus-stack for my cluster.
kube-prometheus-stack
Installs the kube-prometheus-stack, a collection of Kubernetes manifests, Grafana dashboards, and Prometheus rules combined with documentation and scripts to provide easy to operate end-to-end Kubernetes cluster monitoring with Prometheus using the Prometheus Operator.
Cloudify

Cloudify is an open source, multi-cloud orchestration platform featuring a unique ‘Environment as a Service’ technology that has the power to connect, automate and manage new & existing infrastructure and networking environments of entire application pipelines. Using Cloudify, DevOps teams (& infrastructure &operations groups) can effortlessly make a swift transition to public cloud and cloud-native architecture, and have a consistent way to manage all private & public environments. Cloudify is driven by a multidisciplinary team of industry experts and hero-talent.
https://cloudify.co/
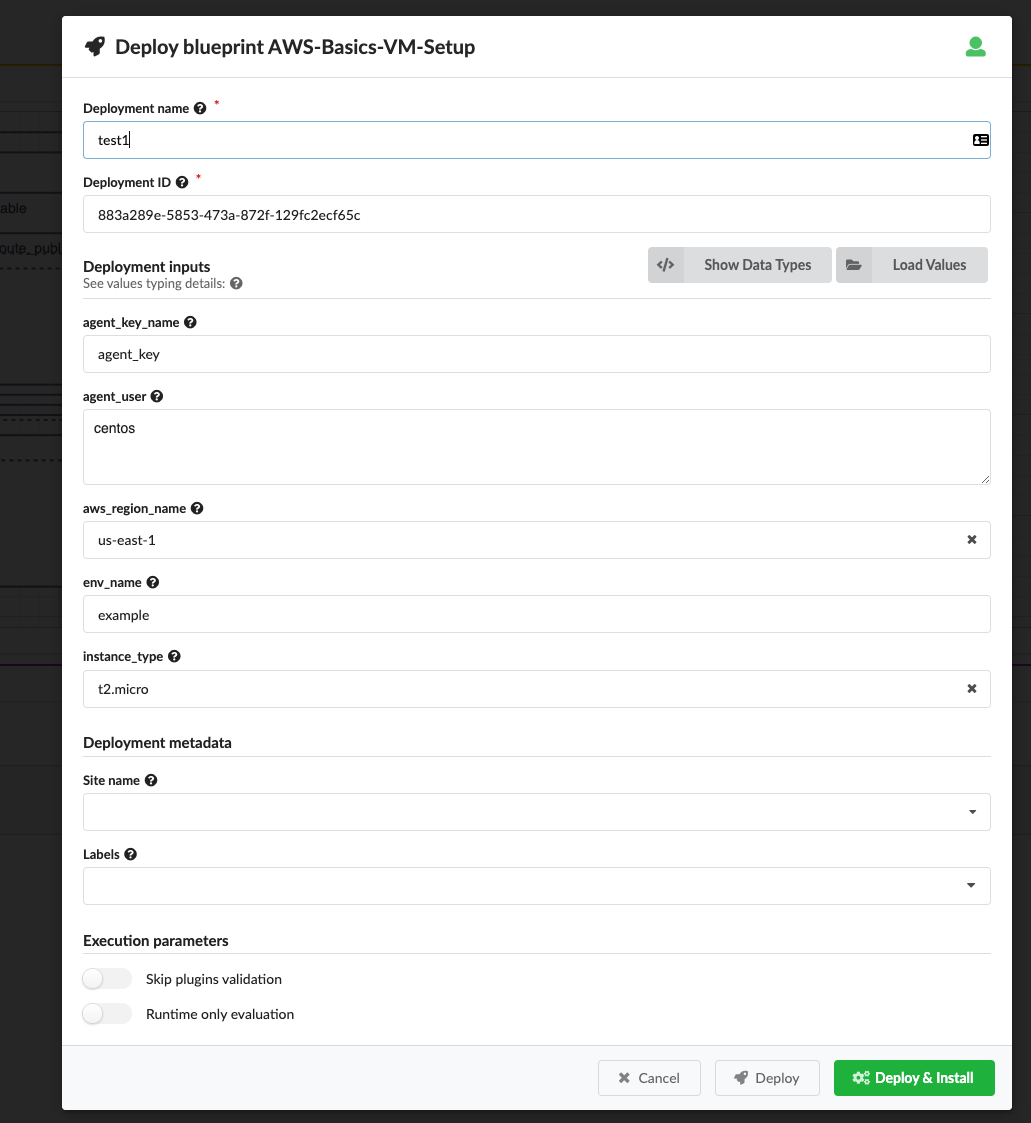
Let’s Install Cloudify Manager and VPA.
To be practical, I will deploy cloudify manager application to EKS using this helm chart: https://github.com/cloudify-cosmo/cloudify-helm
Install cloudify manager to EKS cluster
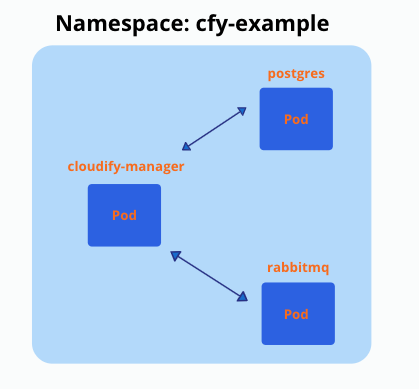
I will use this setup for deployment:
A good explanation of how to install it, you can find here: https://github.com/cloudify-cosmo/cloudify-helm/tree/master/cloudify-manager-worker
-
Need to generate a self signed certificate to encrypt communication between all components inside of EKS cluster.
-
Install cloudify manager / postgresql / rabbitmq with helm charts to specific namespace
# Final result must look like this, after installing this setup to a specific namespace

$ kubectl get pods
NAME                        READY   STATUS    RESTARTS   AGE
cloudify-manager-worker-0   1/1     Running   0          3m
postgres-postgresql-0       1/1     Running   0          3m
rabbitmq-0                  1/1     Running   0          3m
Vertical Pod Autoscaler
Vertical Pod Autoscaler (VPA) frees the users from necessity of setting up-to-date resource limits and requests for the containers in their pods. When configured, it will set the requests automatically based on usage and thus allow proper scheduling onto nodes so that appropriate resource amount is available for each pod. It will also maintain ratios between limits and requests that were specified in initial containers configuration.
It can both down-scale pods that are over-requesting resources, and also up-scale pods that are under-requesting resources based on their usage over time.
https://github.com/kubernetes/autoscaler/tree/master/vertical-pod-autoscaler
Install Vertical Pod Autoscaler
A good explanation of how to install it, you can find here: https://github.com/kubernetes/autoscaler/tree/master/vertical-pod-autoscaler
git clone https://github.com/kubernetes/autoscaler.git
cd autoscaler
./hack/vpa-up.sh
One of the problems I found immediately after installation is ‘vpa-admission-controller’ in ‘ContainerCreating’ state:
kubectl get pod -n kube-system | grep vpa-admission-controller

vpa-admission-controller-6cd546c4f-s6cgr   0/1     ContainerCreating   0
To fix that you need to upgrade openssl to version 1.1.1
please upgrade openssl to version 1.1.1 or higher (needs to support -addext option) or use ./hack/vpa-up.sh on the 0.8 release branch.
In my case it’s less relevant because I am using VPA in ‘recommendation’ mode, I will explain why in a couple of minutes.
Deploying VPA manifest for cloudify manager
# cm-vpa.yaml: VPA configuraton for Cloudify manager
apiVersion: autoscaling.k8s.io/v1
kind: VerticalPodAutoscaler
metadata:
  name: cm-vpa
spec:
  targetRef:
    apiVersion: "apps/v1"
    kind:       StatefulSet
    name:       cloudify-manager-worker
  updatePolicy:
    updateMode: "Off"
kubectl apply -f cm-vpa.yaml
updateMode: ‘Off’, means we using VPA in recommendation mode only.
How to properly calculate requests for your workloads?
Run cloudify manager on EKS and observe metrics from prometheus/grafana
Let’s run different workflows with cloudify manager and observe CPU/Memory usage in prometheus/grafana.
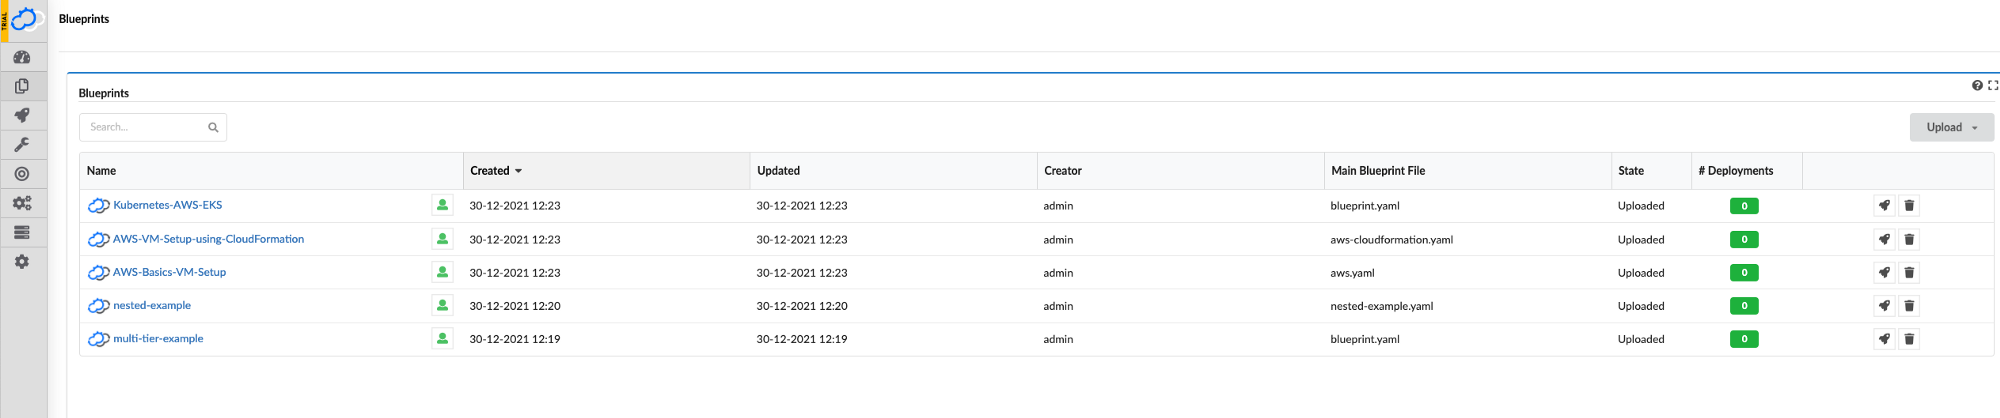
Cloudify Manager’s dashboard after deployment
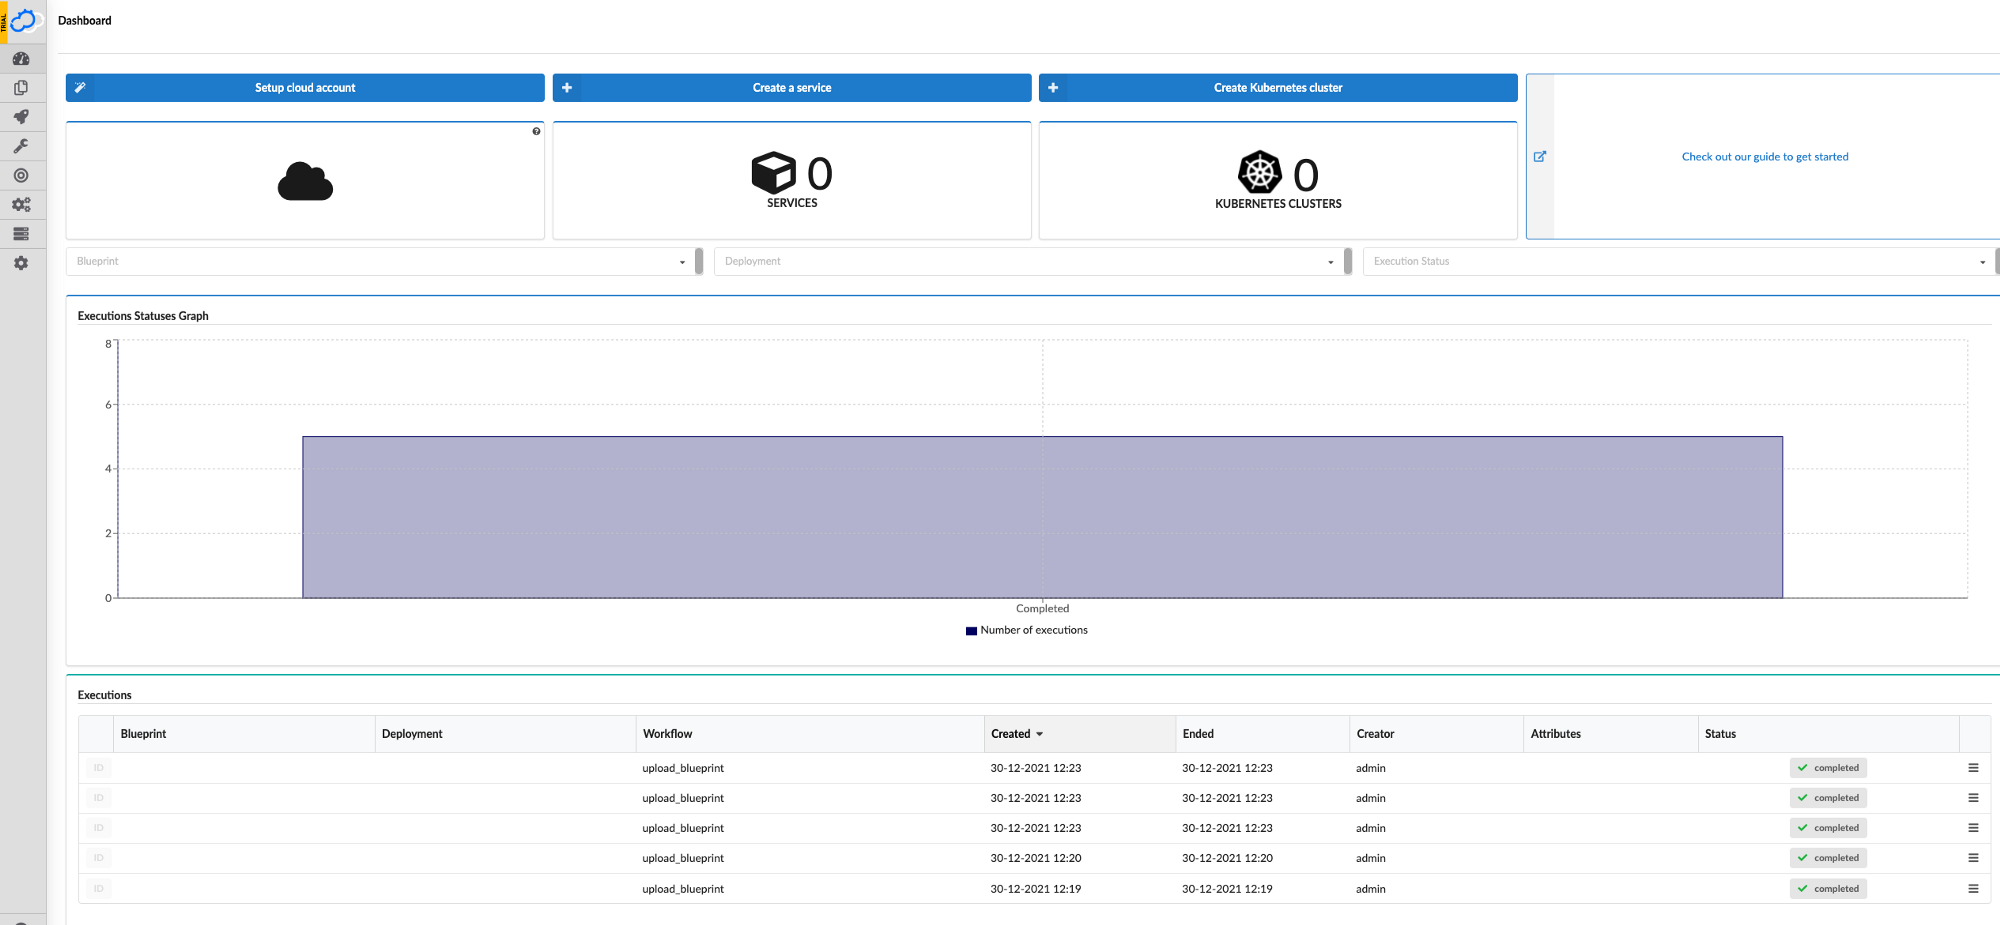
Let’s run a couple of blueprints(workflows) in parallel to increase CPU/Memory usage of the application and to get a better picture of resource consumption.
Let’s look at prometheus/grafana:
I am using kube-prometheus-stack with already preinstalled dashboards
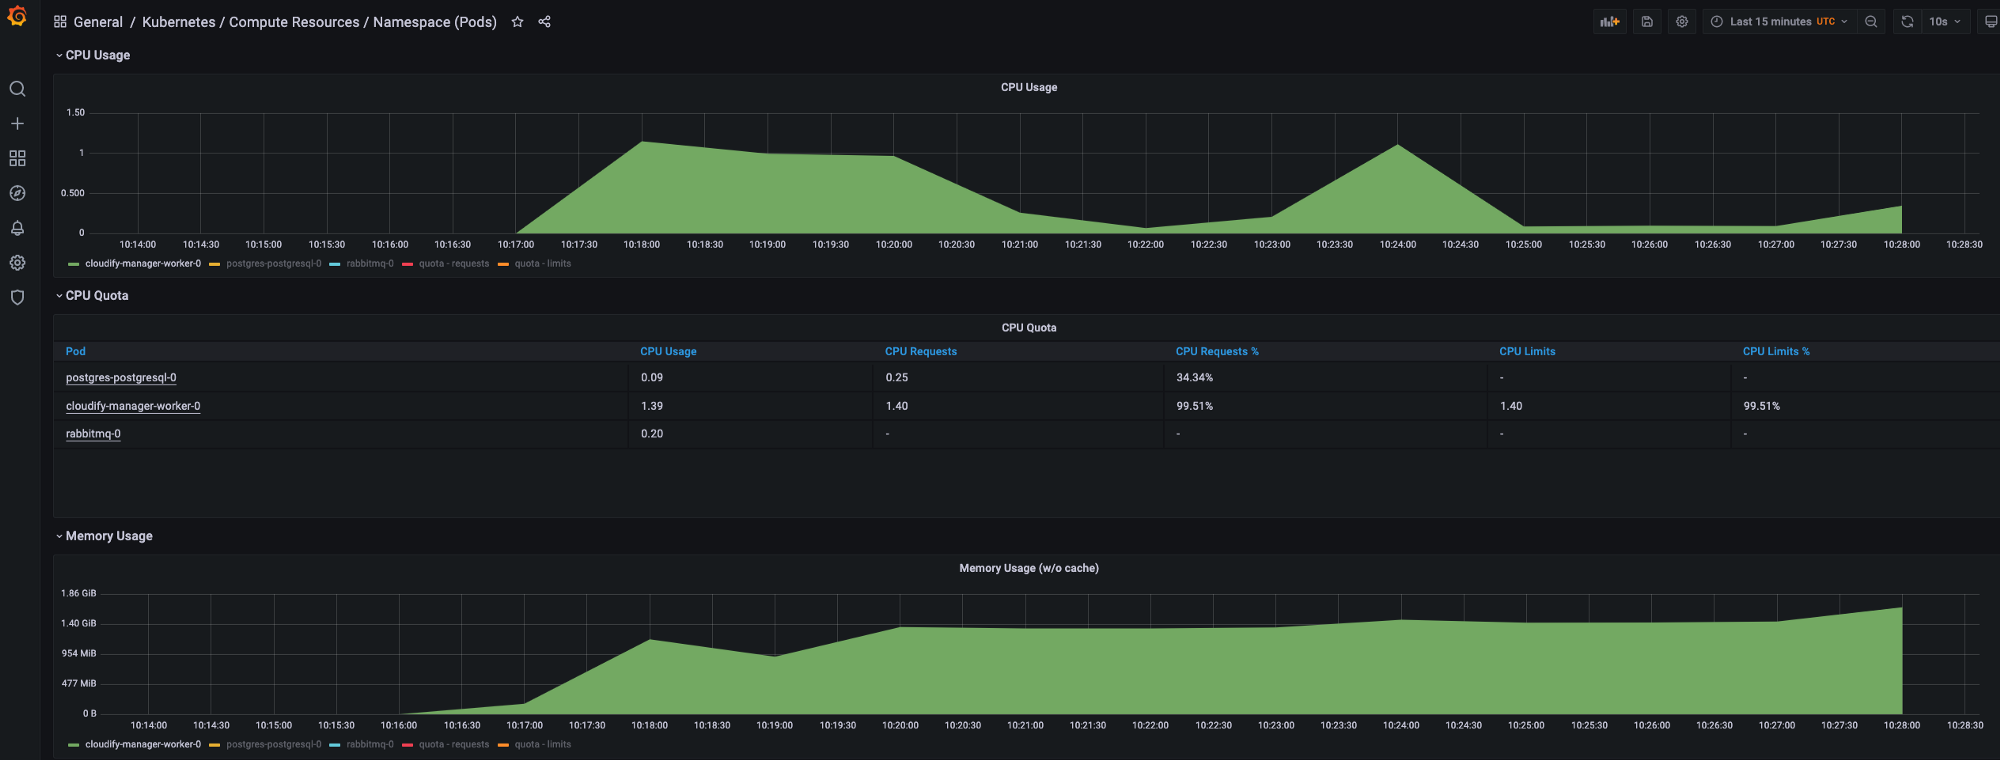
We can use also different load testing tools to get more realsitic CPU/Memory resource consumption, but it’s sufficient to run multiple workloads with Cloudify Manager for the showcase.
Ok, so looking at metrics of prometheus/grafana we can see CPU usage peaks during application start and when executing different workloads (blueprints deployment), based on those metrics I would try to set requests for CPU/Memory as:
resources:
  requests:
    memory: 1.4Gi
    cpu: 1.2
Of course, need to do some tuning and tests around those requests, but for me it will be around those values, also need to be more carefull with limits, because if we set memory limits less than 1.4G it may result in OOMKilled.
Getting the recommendations from deployed VPA manifest
Much easier would be to look at recommendations of VPA:
$ kubectl describe vpa cm-vpa
Name:         cm-vpa
Labels:       <none>
API Version:  autoscaling.k8s.io/v1
Kind:         VerticalPodAutoscaler
Metadata:
  Creation Timestamp:  2021-12-30T10:14:19Z
  Generation:          14
    Manager:         recommender
    Operation:       Update
    Time:            2021-12-30T10:17:16Z
  Resource Version:  181792413
  UID:               8e71bc93-1fdb-418d-bfc2-2ca49cbc7efc
Spec:
  Target Ref:
    API Version:  apps/v1
    Kind:         StatefulSet
    Name:         cloudify-manager-worker
  Update Policy:
    Update Mode:  Off
Status:
  Conditions:
    Last Transition Time:  2021-12-30T10:17:16Z
    Status:                True
    Type:                  RecommendationProvided
  Recommendation:
    Container Recommendations:
      Container Name:  cloudify-manager-worker
      Lower Bound:
        Cpu:     108m
        Memory:  1472083381
      Target:
        Cpu:     1388m
        Memory:  1939879381
      Uncapped Target:
        Cpu:     1388m
        Memory:  1939879381
      Upper Bound:
        Cpu:     244716m
        Memory:  288935733008
Events:          <none>
Look at the Recommendation/Target section, this is the recommended CPU requests and memory requests for the container.
Easy enough, and the only thing you need to do is to deploy cm-vpa.yaml manifest.
Using Goldilocks
https://goldilocks.docs.fairwinds.com/
Goldilocks is a utility that can help you identify a starting point for resource requests and limits.
Installation
https://goldilocks.docs.fairwinds.com/installation/#requirements
kubectl create ns goldilocks

helm install goldilocks --namespace goldilocks fairwinds-stable/goldilocks
Enable Namespace to appear in Dashboard
Pick an application namespace and label it like so in order to see some data:
kubectl label ns goldilocks goldilocks.fairwinds.com/enabled=true
After that, you should start to see VPA objects in that namespace.
Viewing the Dashboard
The default installation creates a ClusterIP service for the dashboard. You can access via port forward:
kubectl -n goldilocks port-forward svc/goldilocks-dashboard 8080:80
Then open your browser to http://localhost:8080
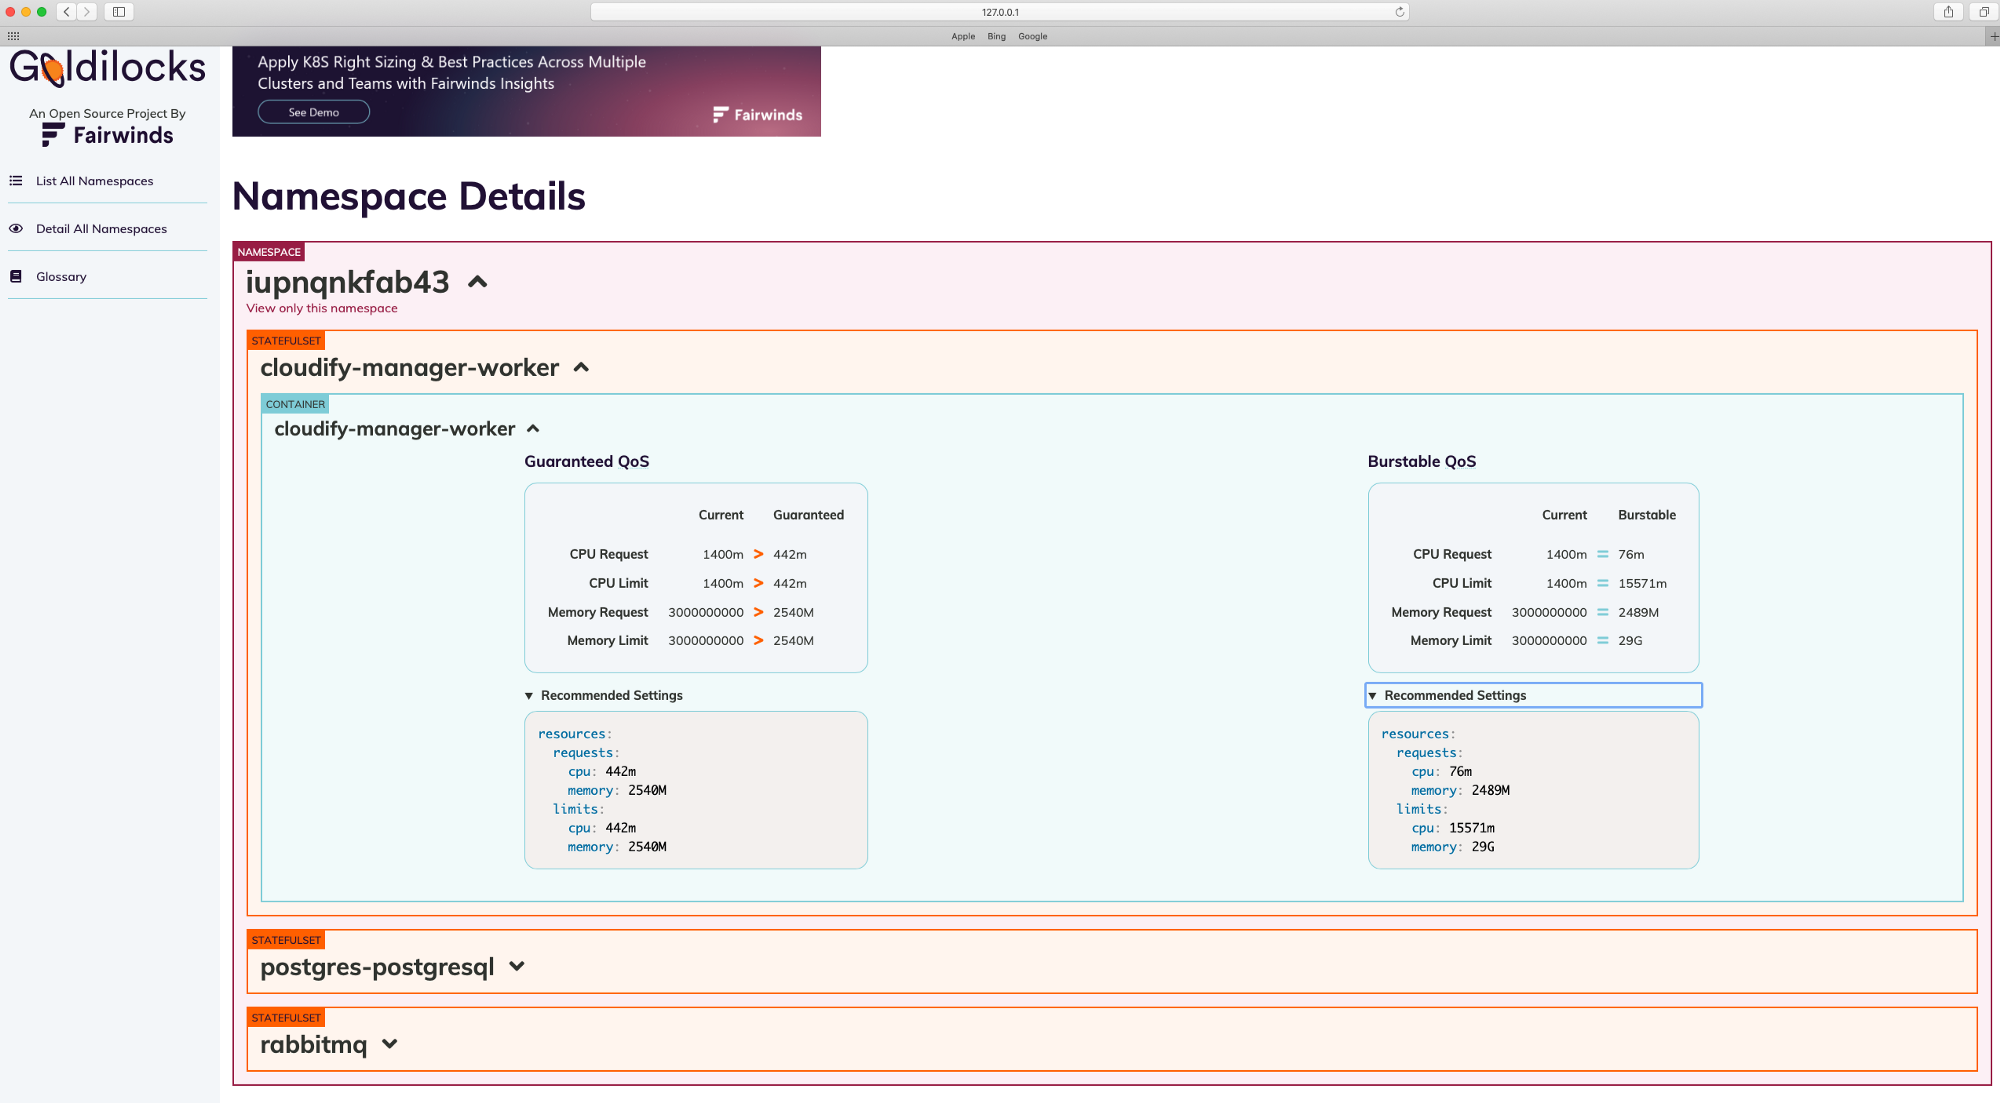
I installed cloudify manager to ‘iupnqnkfab43’ namespace.
I took snapshot after all workflows finished to run and CPU/Memory usage decreased, that why CPU requests recomendations is lower in snaphot.
Encountered issues
Numerous restarts of ‘goldilocks-controller’ (OOMKilled), to fix the issue I increased CPU/Memory limits to:
limits:
  cpu:     100m
  memory:  320Mi
Great tool for requests recommendations, which automatically deploys VPA manifests to labeled namespace, only thing needed is to install helm chart and then label needed namespace with ‘goldilocks.fairwinds.com/enabled=true’.
Using VPA with dynamic requests tuning enabled
One of the most difficult problems faced by DevOps is how many resources need to allocate for a workloads to make it operate optimally. Imagine you have a tool that will tune resources of a workload dynamically, based on usage?
VPA with updateMode: “Auto”, may potentially be this tool in the future, but not currently.
So why not to use updateMode: “Auto” in production?
- Updating running pods is an experimental feature of VPA. Whenever VPA updates the pod resources the pod is recreated, which causes all running containers to be restarted. The pod may be recreated on a different node.
Meaning we can experience a ‘downtime’, which obviously is not good.
One of the possible improvements may be ‘in-place updates’ of resource parameters, which is currently a limitation of Kubernetes, and to change resource parameters you need to recreate the pod with new params.
‘in-place updates’ discussion happens in the Kubernetes community for already a couple of years: https://github.com/kubernetes/community/pull/1719
-
I didn’t find any real use cases of VPA usage with ‘auto’ mode in production.
-
Not many examples and poor documentation meantime, hope this will be improved in the future, cause it’s a very promising project.
-
I want to have more control over VPA with ‘auto’ mode, for example actively update resources for workflows in a specific window of time or use some schedules to do that…
In this post, I touched one of the most difficult problems faced by DevOps/SRE: How to set proper requests for your workloads, how to allocate enough resources for a workloads to operate optimally and not to overprovision in the same time.
We looked at three options to find proper requests for your workloads which may be very useful. Thank you for reading, I hope you enjoyed it, see you in the next post.
If you want to be notified when the next post of this tutorial is published, please follow me on Twitter @warolv.
For consulting gigs you can reach me on Upwork
Instagram: @warolv
Medium account: warolv.medium.com
Leave a comment